What it is
A set of open source programs that work together to keep track of the state of a network over time. Each one has a role:
- SNMP and collectd collect the data. SNMP, short for Simple Network Management Protocol, is the language that routers and other equipment use to report their status. collectd is a program that runs continuously in the background and gathers this information at regular intervals.
- InfluxDB stores the data. It is a time-series database, built to record measurements together with the moment they were taken.
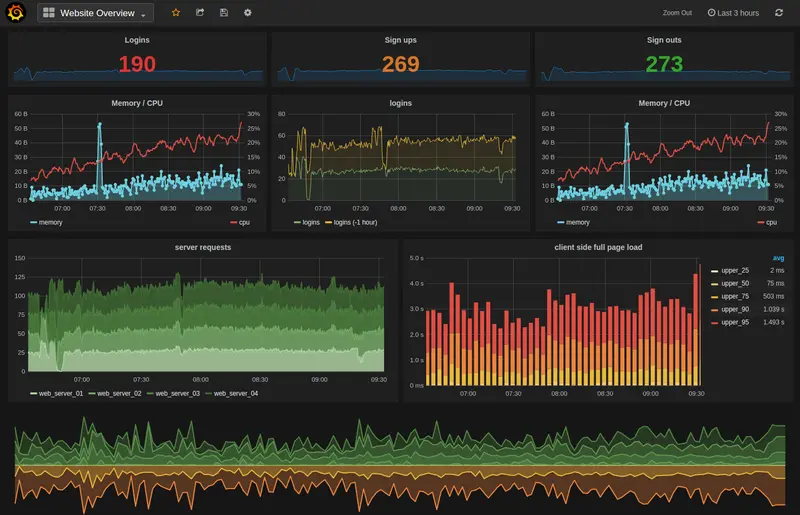
- Grafana displays the data in dashboards with charts, which can be viewed in a web browser.
In TECER
It was the stack chosen to keep track of the internet link, the monitoring server, the network routers and the off-grid solar kit during the Phase 1 tests (see Phase 1 (BOLT): the project and the setting). Remote monitoring with Grafana was part of the plan for the field implementation.
Source
- InfluxData: InfluxDB
- collectd
- Grafana Labs
- Opening image: Grafana dashboard (2016), by Linux Screenshots from USA, licensed under Creative Commons Attribution 2.0.
Last updated on